
Milestone 3: Generating UML Diagrams from Survey Analysis for House Management App


In the previous post, we delved into the questions and analysis from the feedback survey. Thanks to the contribution of a dedicated scrum master(Chefu Beltus) who volunteered for this project, we were able to make progress. In this post, I'll take it a step further and explain how I generated the Unified Modeling Language (UML) based on the survey analysis.
As a developer, I had an idea of how I want the system to operate but since this app is community driven I wanted the community to be involved in deciding which functionality and features this application should have. This approach ensures that the features chosen by the community are solutions to the pain points they are experiencing.
To archive this objective of this post I will start by explaining what UML diagrams are and how I generated the UML from the survey data we collected.
What is UML?
UML, which stands for Unified Modeling Language, is a standardized visual modeling language used in software engineering to design, visualize, specify, and document software systems. UML provides a set of graphical notations that allow developers, designers, and stakeholders to communicate and understand the structure, behavior, and relationships of a system. Examples of UML diagrams include class diagrams, activity diagrams, Component Diagrams, Use Case Diagrams, etc.
Structural view of the system
based on the analyzed data from the previous article, I was able to determine several aspects:
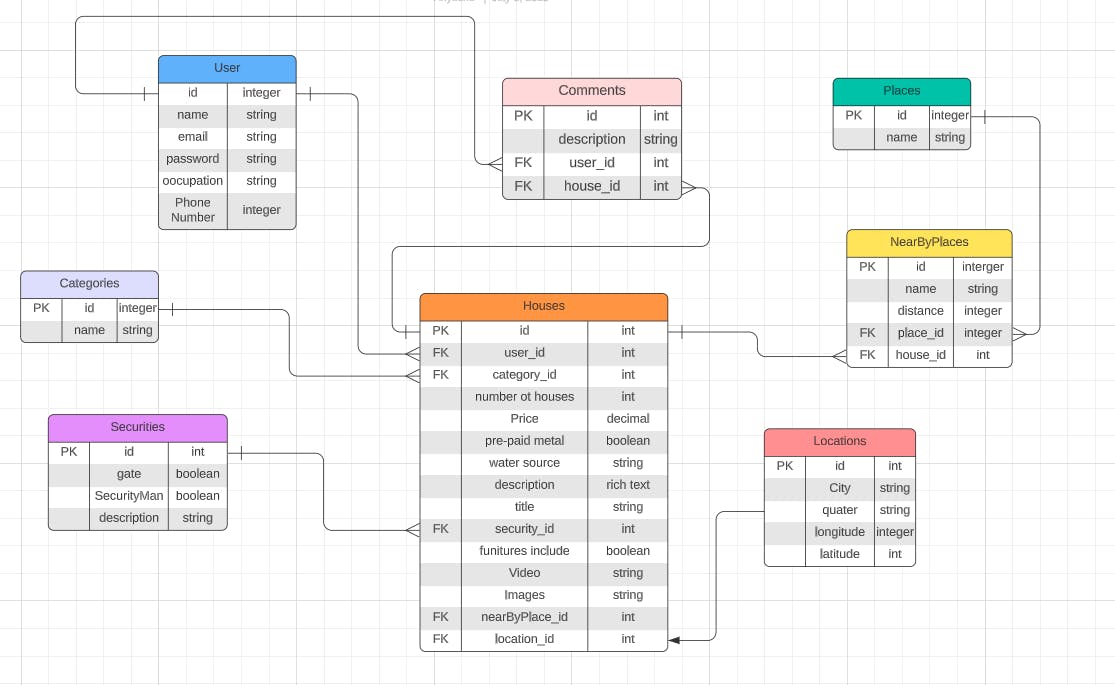
The number of entities/classes: In our system, each problem or challenge faced by community members represents a table or class. Therefore, we have identified eight tables or classes in the system, including Users, houses, categories, places, securities, locations, comments, and nearby places tables/entities.
Attributes of each table: Attributes represent the properties or characteristics of an entity(real-world object). In our system, each table has a list of attributes for example in the user's table we have the name, email, password, phone number, and occupation.
Relationship between tables: Relationships describe how tables connect with each other in the system. By analyzing the data, we can identify the relationships that exist between the tables. For instance, there is a one-to-many relationship between the Users and Houses tables, meaning a single user can have multiple houses, and many houses can belong to a single user. Additionally, there is a one-to-one relationship between the Houses and Locations tables, indicating that a house can have only one location, and vice versa.
Below is the class diagram of the house management system
Using a tool like Lucidchart to draw UML diagrams: Lucidchart is a popular web-based diagramming tool that allows you to create various types of diagrams, including UML diagrams. It provides a user-friendly interface and a wide range of shapes and symbols to create professional-looking diagrams.
Primary Key (PK) and Foreign Key (FK) In a database, a primary key serves as a unique identifier for each record in a table. It ensures that each record can be uniquely identified and acts as a reference for relationships with other tables. On the other hand, a foreign key is a field in a table that refers to the primary key of another table. It establishes relationships between tables, indicating that the records in one table are related to the records in another table.
Columns in a Class/Table: Each table has three columns:
The first column describes the keys and specifies if an attribute is a primary key or a foreign key.
The second column provides the names of the attributes.
The third column specifies the data type of each attribute.
Rows represent attributes: In the context of UML diagrams, rows in a table represent the attributes or properties of the corresponding class or table. Attributes define the characteristics or properties of that class or table.
Lines connecting tables represent relationships: In UML diagrams, relationships between tables or classes are represented by lines connecting them. the lines show the relationships between the tables for example:
One-to-Many relationship between the "users" table and the "houses" table. This means that a single user can have multiple houses.
The one-to-one relationship between the "locations" table and the "houses" table. This means that each house can have only one location.
Overcoming Difficulties in Establishing Relationships
During the process, I encountered challenges in identifying the relationships between the tables. However, I dedicated time to research and reviewing other UML designs, which allowed me to overcome this obstacle. With one milestone accomplished, the next step is to transform the UML into a database.
Stay tuned for the upcoming post.